GEOTECHNICAL ENGINEERING1
BRIGHTON
HomeGeophysicsElectrical resistivity / VES (Vertical Electrical Sounding)

Electrical Resistivity Surveys and VES in Brighton

Practical geotechnics, field-tested.

LEARN MORE

The ground conditions across Brighton shift dramatically between the chalk downland of the South Downs and the coastal plain deposits along the seafront. A site near Preston Park might sit on superficial Coombe deposits overlying chalk, while a plot in the Kemptown area could encounter raised beach shingle and head deposits. These contrasts demand a geophysical approach that can distinguish lithological boundaries without excessive intrusion. The resistivity method maps these transitions by measuring how the subsurface resists electrical current flow. Chalk with flint bands returns a markedly different signature than saturated valley gravels or Clay-with-Flints, and understanding that signature early in the investigation programme saves both time and budget—particularly on constrained urban plots where access for drilling rigs is limited.

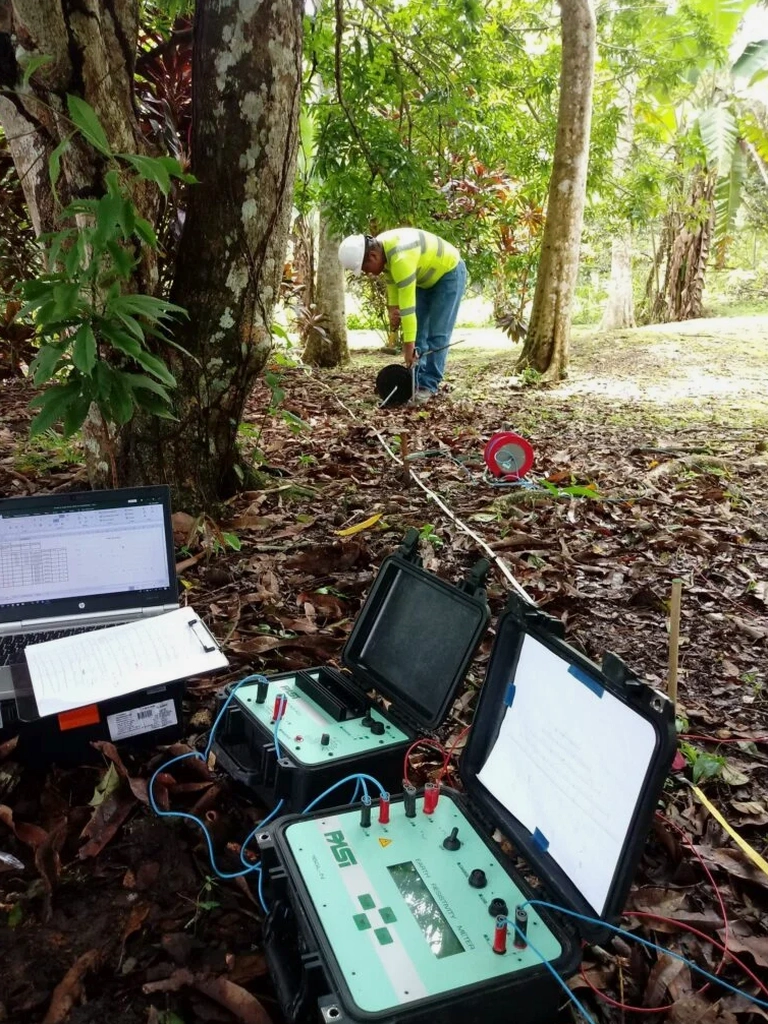
The electrical signature of weathered chalk in Brighton—low resistivity over high—reveals the rockhead position without a single borehole being sunk.

Our service areas

Methodology and scope

The Newhaven Chalk Formation underlies much of Brighton, and its variable weathering profile creates a karstic surface with solution features that complicate foundation design. Vertical Electrical Sounding probes these dissolution zones by expanding the electrode spread and reading resistivity changes at depth increments. A typical Brighton VES survey might reveal a low-resistivity upper layer of Head or Coombe deposits—8–15 ohm.m when saturated—transitioning to a high-resistivity chalk layer exceeding 80 ohm.m. Where the resistivity contrast is sharp, we map the rockhead position; where it is gradual, we interpret a softened, putty-chalk transition zone. This electrical signature often correlates with SPT N-values, and where borehole control is available we cross-calibrate the geophysical model. For sites near the Brighton Marina or the old gasworks, saline intrusion and anthropogenic fill introduce conductive anomalies that require careful array design and inversion modelling. We complement the sounding data with seismic refraction when the project demands a velocity model alongside the resistivity section.
Electrical Resistivity Surveys and VES in Brighton
Technical reference — Brighton

Local considerations

BS 5930:2015 and Eurocode 7 Part 2 stress the importance of adequate ground investigation coverage, and in Brighton the karstic nature of the chalk introduces a specific hazard: dissolution pipes and buried doline features. These voids or soft zones can be missed by a sparse borehole grid yet present a resistivity contrast detectable by a well-designed VES or 2D imaging line. A collapse feature filled with low-resistivity clay and saturated debris, surrounded by high-resistivity competent chalk, creates a diagnostic anomaly. The cost of missing such a feature—differential settlement, piling refusal on flint bands, or unexpected groundwater ingress—far outweighs the cost of a targeted resistivity survey. The British Geological Survey's Brighton Chalk dissolution hazard maps confirm the prevalence of these features across the city, particularly in the Hanover and Queen's Park areas where historic mapping shows concentrations of sinkholes.

Need a geotechnical assessment?

Reply within 24h.

Email: contact@geotechnical-engineering1.com

Explanatory video

Applicable standards

BS 5930:2015 – Code of practice for ground investigations, BS EN 1997-2:2007 – Eurocode 7: Geotechnical design – Ground investigation and testing, BS 1377 – Standard Guide for Using the Direct Current Resistivity Method, BGS (British Geological Survey) – Brighton Chalk dissolution hazard mapping

Technical parameters

ParameterTypical value
MethodSchlumberger and Wenner arrays, 1D VES and 2D ERT
Depth of investigationTypically 10–60 m, depending on array spread (AB/2)
Measured propertyApparent resistivity (ohm.m), inverted to true resistivity
Chalk (dry, competent)>80 ohm.m
Saturated Head / Coombe deposits8–25 ohm.m
Saline groundwater influence<5 ohm.m
Data reportingLog-log curves, 1D layered models, 2D pseudosections
Standards appliedBS 5930:2015, BS EN 1997-2, BS 1377

Frequently asked questions

How much does a VES or resistivity survey cost for a typical Brighton residential site?

For a single-family plot or small extension site in Brighton, a Vertical Electrical Sounding with 3–5 centre points and basic interpretation typically runs between £450 and £800, depending on array depth and access constraints. A 2D ERT line across a larger site costs more due to the multi-electrode setup and processing time.

How deep can electrical resistivity methods investigate in the Brighton chalk?

With Schlumberger array spreads extending to AB/2 distances of 100–150 metres, we routinely reach investigation depths of 40–60 metres in the Brighton area. The actual depth of penetration depends on the resistivity contrast between layers and the available space for electrode layout. Urban sites with limited spread length reduce the effective depth, and we adjust the array geometry accordingly.

Do buried services and urban noise affect resistivity readings in Brighton?

Yes, and Brighton's dense Victorian-era infrastructure presents challenges. Buried metallic pipes, reinforced concrete, and stray earth currents from railway lines or tram remnants can introduce noise. We mitigate this by running reciprocal measurements, using stacking routines during acquisition, and designing array orientations parallel to known service corridors where possible. The inverted models are quality-checked against RMS misfit and any anomalous data points are flagged in the report.

Location and service area

We serve projects across Brighton and surrounding areas.

View larger map