GEOTECHNICAL ENGINEERING1
BRIGHTON
HomeGeophysicsSeismic tomography (refraction/reflection)

Seismic Tomography (Refraction & Reflection) in Brighton

Practical geotechnics, field-tested.

LEARN MORE

A recent redevelopment project on the Brighton seafront faced a familiar challenge: mapping the contact between the superficial Coombe Deposits and the underlying White Chalk Subgroup. Traditional boreholes were providing point data, but the structural engineers needed a continuous profile to assess dissolution features and potential voids beneath the foundation footprint. The site investigation was supplemented with seismic tomography, deploying a 72-channel seismograph with 5-metre geophone spacing along three intersecting lines. The resulting P-wave velocity tomograms revealed a distinct low-velocity zone at 4 metres depth, later confirmed by a test pit inspection as a solution pipe filled with soft clay. With recorded velocities jumping from 900 m/s in the overburden to over 2,400 m/s in the competent chalk, the foundation design was adjusted to bypass the anomalous zone entirely.

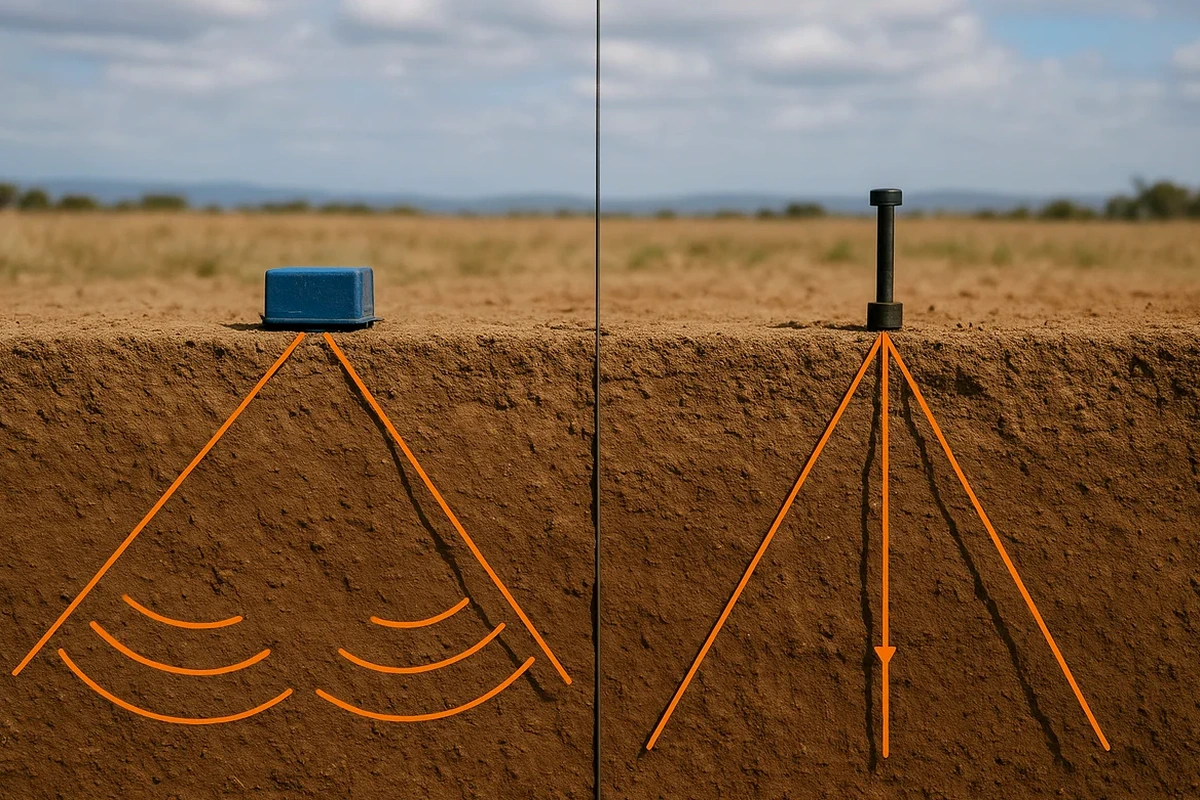
Seismic tomography converts a handful of borehole logs into a continuous velocity cross-section, revealing hidden dissolution features in the Brighton chalk that point investigations alone can miss.

Our service areas

Methodology and scope

Brighton's underlying geology is dominated by the Upper Cretaceous Chalk, a fine-grained limestone known for its karstic weathering and sudden lateral variations. Seismic refraction surveys in the city typically record P-wave velocities ranging from 1,600 to 2,800 m/s in moderately fractured chalk, dropping below 1,200 m/s where the rock is highly weathered or infilled with soft material. Seismic reflection, while more processing-intensive, can resolve sub-horizontal features such as flint bands and marl seams at depths exceeding 30 metres. Fieldwork follows BS 5930:2015+A1:2020 procedures, with shot points generated by a 12 kg sledgehammer on a steel plate for shallow targets or an accelerated weight drop for deeper penetration. Data is processed using iterative inversion algorithms that minimize the RMS error between observed and calculated travel times, producing a final velocity model gridded at 0.5-metre intervals. The method integrates naturally with resistivity surveys when the presence of saline groundwater near the coast demands a complementary geophysical constraint to distinguish saturated clays from intact rock.
Seismic Tomography (Refraction & Reflection) in Brighton
Technical reference — Brighton

Local considerations

Brighton sits at approximately 50.82°N on the English Channel coast, with sea cliffs rising to over 30 metres at East Cliff. The chalk in this area is classified as a Principal Aquifer, meaning groundwater flow through fractures can accelerate dissolution over engineering timescales. Undetected solution features beneath a building footprint represent a Class 3 geohazard under Eurocode 7, capable of triggering differential settlement that exceeds serviceability limits. Seismic tomography mitigates this risk by producing a spatially continuous image of the subsurface, flagging velocity anomalies that correspond to loose infill or voided zones before construction begins. For sites within 500 metres of the coastline, the additional challenge of saline intrusion alters the electrical properties of the groundwater, making seismic methods the primary geophysical tool for foundation risk assessment where resistivity alone becomes ambiguous.

Need a geotechnical assessment?

Reply within 24h.

Email: contact@geotechnical-engineering1.com

Applicable standards

BS 5930:2015+A1:2020 – Code of practice for ground investigations, BS EN 1997-2:2007 (Eurocode 7) – Ground investigation and testing, BS 1377 – Standard Guide for Seismic Refraction

Technical parameters

ParameterTypical value
Survey standardBS 5930:2015+A1:2020, BS 1377
Typical P-wave velocity (competent chalk)2,200 – 2,800 m/s
Typical P-wave velocity (weathered chalk)800 – 1,600 m/s
Geophone spacing2 m – 5 m depending on target depth
Maximum investigation depth (refraction)25 m – 40 m with AWD source
Shot point interval5 m (end shots, midpoints, off-end)
Recording system72-channel seismograph, 24-bit resolution

Frequently asked questions

What is the typical cost of a seismic tomography survey in Brighton?

A refraction survey with 48 geophones and 5-metre spacing covering a 240-metre profile line typically costs between £2,240 and £4,250 depending on site access, the number of shot points, and processing requirements. Reflection surveys with deeper penetration are priced at the upper end of this range due to longer acquisition times and more intensive data processing.

How does seismic tomography compare to boreholes for chalk investigation in Brighton?

Boreholes provide direct lithological data at a single point, while seismic tomography delivers a continuous velocity cross-section between those points. For Brighton's chalk, where solution pipes and fractures can occur unpredictably, the combination of both methods is specified in BS 5930:2015+A1:2020 for sites with a moderate to high geohazard rating. The tomography identifies the lateral extent of anomalies that a borehole might miss entirely if it falls between features.

Can seismic surveys be conducted on busy streets in Brighton?

Yes, but with specific operational controls. The energy source is typically a sledgehammer or accelerated weight drop, which produces minimal ground vibration beyond the survey line. Traffic management plans are prepared for surveys on public roads, and the acquisition uses planted geophones on asphalt with a gypsum couplant. Ambient noise from traffic is filtered during processing through frequency-domain stacking to recover clean first arrivals.

Location and service area

We serve projects across Brighton and surrounding areas.

View larger map